
")
Projection based ensemble learning for ordinal regression
María Pérez-Ortiz, Pedro Antonio Gutiérrez and César Hervás-Martínez
Department of Computer Science and Numerical Analysis, University of Córdoba, Rabanales Campus, C2 building, 14004 - Córdoba, Spain.
e-mail: Esta dirección de correo electrónico está siendo protegida contra los robots de spam. Necesita tener JavaScript habilitado para poder verlo.
, Esta dirección de correo electrónico está siendo protegida contra los robots de spam. Necesita tener JavaScript habilitado para poder verlo.
, Esta dirección de correo electrónico está siendo protegida contra los robots de spam. Necesita tener JavaScript habilitado para poder verlo.
This page provides supplementary material for the experimental results in the paper entitled Projection based ensemble learning for ordinal regression accepted in IEEE Transactions on Cybernetics.
http://dx.doi.org/10.1109/TCYB.2013.2266336
Abstract of the paper
The classification of patterns into naturally ordered labels is referred to as ordinal regression. This paper proposes an ensemble methodology specifically adapted to this type of problems, which is based on computing different classification tasks through the formulation of different order hypotheses. Every single model is trained in order to distinguish between one given class (k) and all the remaining ones, but grouping them in those classes with a rank lower than k, and those with a rank higher than k. Therefore, it can be considered as a reformulation of the well-known one-versus-all scheme. The base algorithm for the ensemble could be any threshold (or even probabilistic) method, such as the ones selected in this paper: kernel discriminant analysis, support vector machines and logistic regression (all reformulated to deal with ordinal regression problems). The method is seen to be competitive when compared with other state-of-the-art methodologies (both ordinal and nominal), by using six measures and a total of fifteen ordinal datasets. Furthermore, a different set of experiments has demonstrated the potential scalability and interpretability of the proposed method when using logistic regression as base methodology for the ensemble.
The additional information provided for the experimental section is the following:
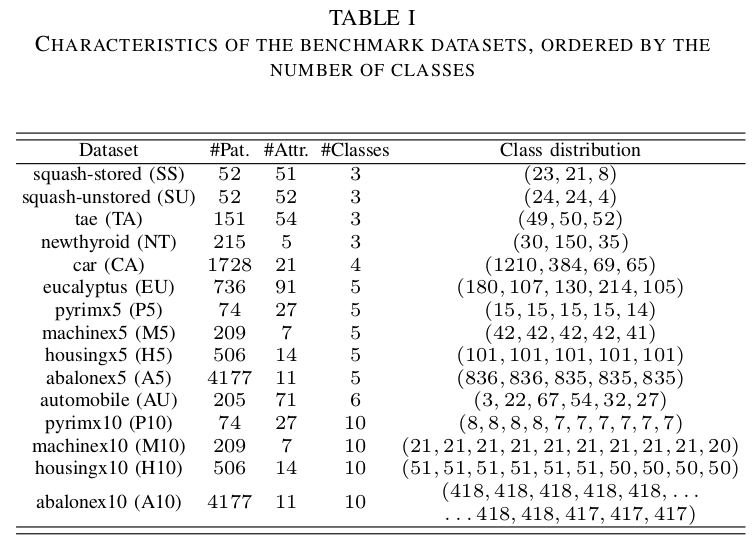
- Datasets: The performance of the methods is analysed using a set of 15 publicly available ordinal datasets. The main characteristics of these datasets can be seen in Table 1, where the name, number of patterns, attributes, classes and distribution were reported. The following link contains the whole set of data partitions in Weka, LibSVM and GPOR formats.
 datasets_ELOR.zip
- Matlab code: The matlab code for the best performing version of the proposal can be downloaded from https://github.com/ayrna/orca, together with a matlab experimentation framework for ordinal regression algorithms.
- Detailed results: The detailed results obtained for each dataset and methodology tested in the experimental study can be seen in the following link. The performance of each one of the 16 methodologies tested can be seen in a different file (.csv or .xls) reporting different measures for evaluation of an ordinal classifier. detailed_Results_ELOR.pdf
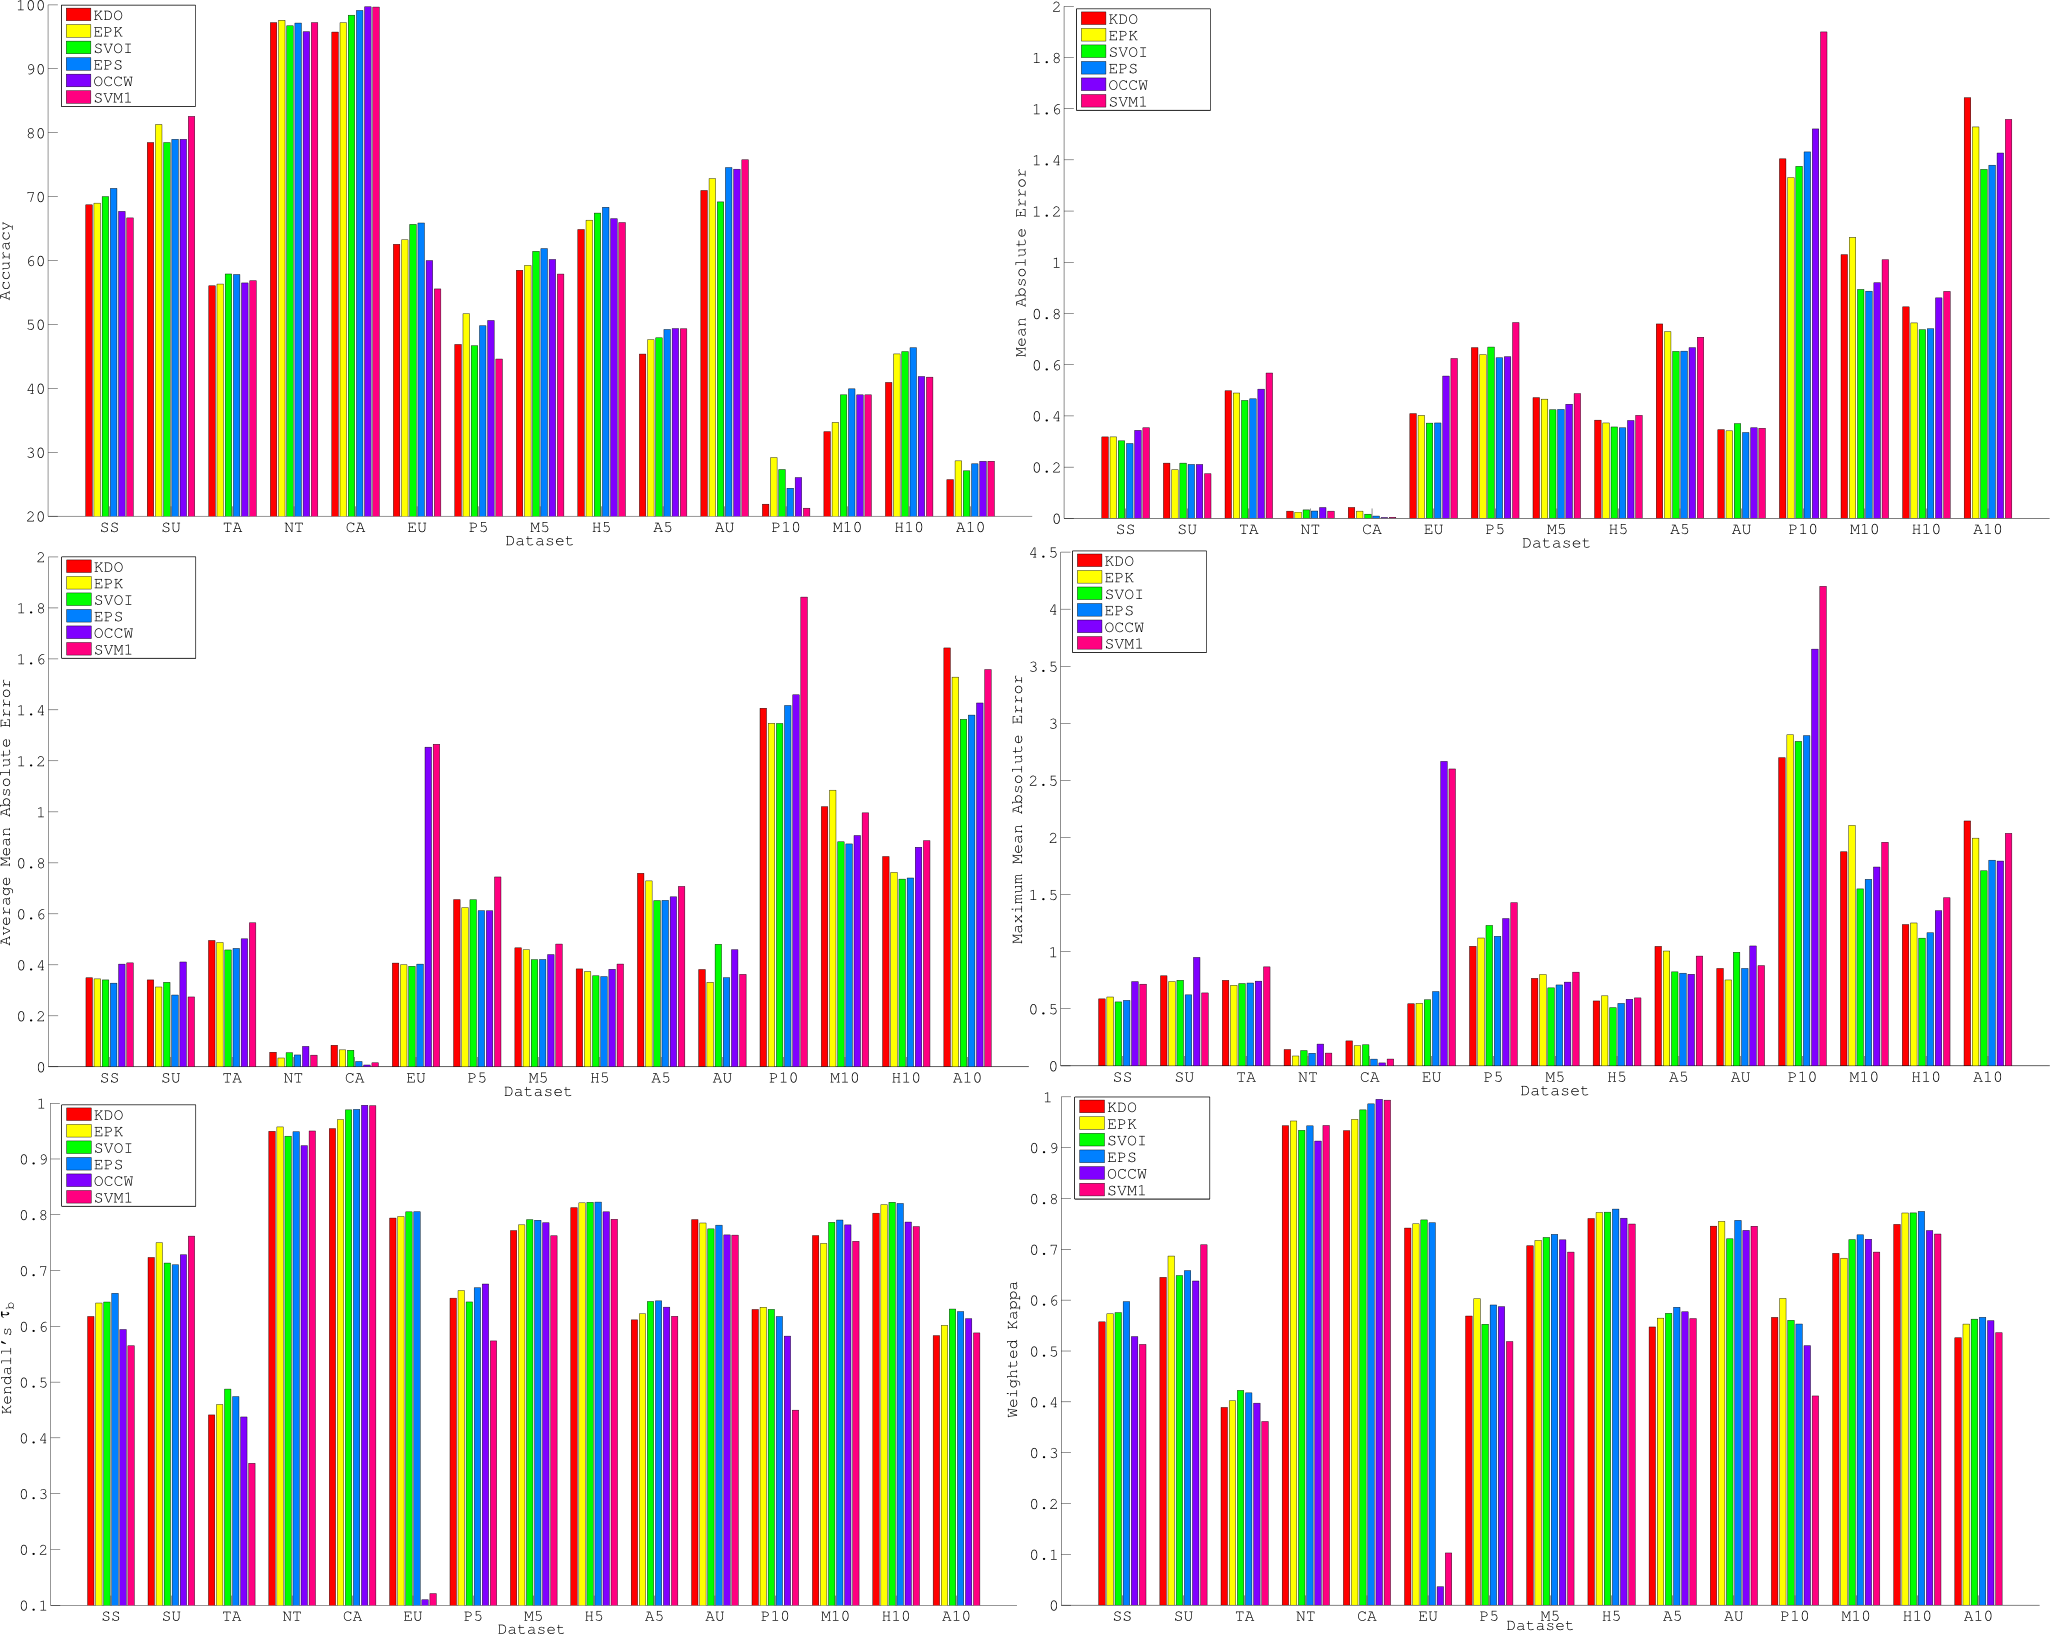
Additionally, visual displays of some of these results are provided in the following figure, where EPK and EPS (the constructed ensembles) and their respective base methods (KDO and SVOI) are compared (along with the most competitive methods from the second comparison, OCCW and SVM1). This figure includes the average for each dataset and the six measures compared.
- Happiness dataset: This dataset was extracted from the "European Social Survey" concerning year 2010 and 26 different countries (Belgium, Bulgaria, Croatia, Cyprus, Czech Republic, Denmark, Estonia, Finland, France, Germany, Hungary, Ireland, Israel, Netherlands, Norway, Poland, Portugal, Russian Federation, Slovakia, Slovenia, Spain, Sweden, Switzerland, Ukraine and United Kingdom). The learning task represents the complex problem of predicting the level of happiness of a person with certain characteristics, beliefs and life circumstances in a Likert scale. The dataset is composed of 41472 instances, 13 attributes and 5 classes. Patterns with missing values have been excluded from the study for simplicity. The classes of the problem have been extracted from an eleven-granularity Likert scale, grouping some adjacent classes for simplicity (extreme classes in the Likert scale have been maintained in the new classification task, labels 1, 2, and 3 in the Likert scale have been grouped in the “unhappy” category, labels 4, 5, and 6 have been grouped in the “neutral” category and finally, labels 7, 8 and 9 have been grouped in the “happy” category). The data pattern distribution is the following: {312, 2285, 10297, 24907, 3671}.
Independent variables of the dataset- Most people can be trusted or you can't be too careful: {you can't be too careful, 1, 2, 3, 4, 5, 6, 7, 8, 9, most people can be trusted}.
- Most people try to take advantage of you, or try to be fair {most people try to take advantage of me, 1, 2, 3, 4, 5, 6, 7, 8, 9, most people try to be fair}.
- Most of the time people helpful or mostly looking out for themselves (people mostly look out for themselves, 1, 2, 3, 4, 5, 6, 7, 8, 9, people mostly try to be helfpul).
- How satisfied with present state of economy in country {extremely dissatisfied, 1, 2, 3, 4, 5, 6, 7, 8, 9, extremely satisfied}.
- How satisfied with the national government {extremely dissatisfied, 1, 2, 3, 4, 5, 6, 7, 8, 9, extremely satisfied}.
- How often socially meet with friends, relatives or colleagues {never, lest than once a month, once a month, several times a month, once a week, several times a week, every day}.
- Anyone to discuss intimate and personal matters with {yes,no}
- Take part in social activities compared to others of same age {much less than most, less than most, about the same, more than most, much more than most}
- Feeling of safety of walking alone in local area after dark {very safe, safe, unsafe, very unsafe}
- Subjective general health {very good, good, fair, bad, very bad}
- Member of a group discriminated against in this country {yes,no}
- Borrow money to make ends meet, difficult or easy {very difficult, quite difficult, neither easy nor difficult, quite easy, very easy}.
- Important to help people and care for others well-being {very much like me, like me, somewhat like me, a little like me, not like me, not like me at all}.
How happy are you {extremely unhappy, unhappy, neutral, happy, extremely happy}
For more information about the data variables go to http://ess.nsd.uib.no/downloadwizard/ - SpanishFleet dataset: This dataset was obtained from the “Fleet Register On the Net” concerning year 2012 and the whole Spanish fleet to predict the commitment to sustainability of the Spanish vessels, using a categorization of the overexploitation of the gears employed. This categorization was provided by the Food and Agriculture Organization of the United Nations and depends on whether the gear is static or towed or whether it is located in the demersal or pelagic zones. This dataset is composed of 10460 instances, 6 attributes and 10 classes. The data distribution is the following: {245, 187, 873, 57, 86, 7187, 671, 970, 9, 175}.
Independent variables of the dataset- Zone: Zone assigned to a Port {1: Basque country, Cantabria and Asturias, 2: Galiza, 3: West Andalusia, 4: East Andalusia, Valencia Alicante, Balearic Islands and Catalonia, 5: Canary Islands}.
- IRCS code: Has the vessel the International Radio Call Sign?
- Loa: Vessel length expressed in metres.
- Ton Gt: Total capacity of the vessel, expressed in volumetric tons of 100 cubic feet.
- Main power: Main vessel engine power in Kilowatts.
- Auxiliary power: Auxiliar vessel engine power in Kilowatts.
Following a 1990 report of the Food and Agriculture Organization of the United Nations where different gears were categorized, the gears presented in the Spanish Fleet have been classified in this paper according to their environmental impact (from lowest to highest), primarily dependent on whether the gear is static or towed, and secondly, whether it is located in the demersal or pelagic zones.
For more information of this dataset see [1].
[1] M. Pérez-Ortiz, R. Colmenarejo, J. Fernández, and C. Hervás-Martínez, “Can machine learning techniques help to improve the common fisheries policy?” in Proceedings of the International Work Conference on Artificial Neural Networks (IWANN). Springer, Heidelberg (In press), 2013, pp. 278–286.