INTRODUCTION | LITERATURE REVIEW | OBJECTIVES | METHODS | TEAM

PN2019 -PROY I+D – SUBPR. ESTATAL DE GENERACION DE CONOCIMIENTO – PROGRAMA ESTATAL DE GENERACION DE CONOCIMIENTO Y FORTALECIMIENTO CIENT. Y TEC. DEL SISTEMA I+D+i – PEICTI 2017-2020. Referencia PID2019-106510GB-I00
INTRODUCTION
The appearance of the Web in 1989 gave rise to a new communication medium that would transform the current publication system. Up to that moment, the traditional publication system relied on research journals as principal vehicles for the dissemination of research results. This dependence generated the well-known publishers’ concentration and journals crisis, causing a strong increase of the publication costs (Larivière et al., 2015). At the same time, the evaluation of publications became increasingly reliant on the criteria of only two linked products: Science (SCI) and Social Science Citation Indexes (SSCI), and the Journal Citation Report (JCR), both produced by the Institute for Scientific Information (ISI). These products are now provided under the umbrella of the Web of Science platform (WoS). The JCR provides the Journal Impact Factor (JIF), which has become widely used as an indicator to assess individual publications. In this way, the evaluation model reinforced the publishing system, placing research journals in the centre of the evaluation.
In this scenario, the emergence of the Web provided the opportunity to develop an alternative publishing model, much more agile, quick, transparent and inexpensive. An early attempt in this direction was the Budapest Open Access Initiative (Chan et al., 2002), which is one of the foundational texts of the Open Access movement and suggested two different ways to open publication: the Green (depositing preprints in open access repositories) and Gold (publishing in open access journals) routes. Today, these two ways have substantially diverged. The Green route has been the favourite by the Open Access movement, whereas the Gold route has served to strengthen the publishing sector, largely moving from a pay-to-read model (based on library subscriptions) to a pay-to-publish model (Article Processing Charge).
In the face of this transformation of the publishing system, two new products appeared with opposing views. On the one hand, Scopus (2004), created by the scholarly publishing giant Elsevier Scopus reproduced the classical model of indexing based on journal selection criteria, becoming a direct competitor to Web of Science (WoS) (successor to the ISI citation indexes). On the other hand, Google released Google Scholar (GS) (2004), an open academic search engine based on Google technology which indexes any scholarly material available on the Web (inclusive rather than selective), regardless of where it is published (Orduña-Malea et al., 2016a).
Thus, two main approaches to document indexing emerged: the first one based on journal selection criteria (WoS and Scopus), and the second one, an inclusive approach that allows for more document diversity (Google Scholar). Differentiating between these approaches is important because they have an effect on the scientific evaluation tools that can be built with the data they provide.
The inclusive approach was also the one adopted by products that were released later on, such as Microsoft Academic (2011) and Semantic Scholar (2015) which collect the references from the documents themselves, using bots that crawl repositories, publishing platforms, journals websites, etc. Institutional and thematic repositories have especially been a key element in the development of these search engines because they have been primary sources for extracting open metadata about publications (OAI-PMH), also producing specific search engines (BASE). However, in just a few years, several additional freely accessible platforms have emerged (Lens, 2014; 1findr, 2018; Dimensions, 2018) that provide information about publications and citations, in many cases, far more complete than the traditional citation indexes (WoS and Scopus) (Thelwall, 2018a; Martín-Martín et al., 2018a). This flourishing of new bibliometric services in just a couple of years has been possible in part by the appearance of new initiatives that have contributed to the creation of open bibliographic data sources (CrossRef, Microsoft Academic Graph, Initiative for Open Citations), which in turn have facilitated the generation of new tools that reuse their data (OpenCitations, Lens.org).
Besides the development in citation indexes, the Web is hosting alternative platforms that also contributing to the evolution of the scholarly communication system. Based on the Web 2.0 model and the success of the online social networks (Facebook, Twitter), the first scholarly social networks appeared in 2008 (ResearchGate, Academia.edu, Mendeley). These spaces allow the open publishing and sharing of academic results in a social environment, encouraging the interaction among researchers. This activity is measured by new indicators about the usage and appreciation of these materials (recommendations, readers, downloads) and the engagement of their authors (followers/followings, mentions).
In 2011, during a discussion on Twitter about the weaknesses of classic bibliometric analyses (based on WoS and Scopus) the term altmetrics was coined to refer to article-based metrics, as opposed to the traditional journal-based bibliometric indicators (e.g. Journal Impact Factor). The proponents of altmetrics suggest broadening the notion of impact to any event that occurs in the Web, as opposed to focusing only on bibliographic citations. Mentions of articles on social networks, mass media, grey literature and online encyclopaedias should be considered as evidence of dissemination and social impact. Support to this critical movement is offered by several data aggregators or providers that gather these events and compute the altmetric indicators (Altmetric.com, PlumX, ImpactStory).
Thus, the second decade of the 21st Century is now ending and we find ourselves in a diverse and confusing landscape: an overwhelming number of different academic platforms that provide information about the scholarly production and impact at different levels and openly accessible on the Web. New citation indexes, academic search engines, scholarly social networks and altmetric data providers are recent instruments that could be used to track the scientific performance from different perspectives. There is therefore an opportunity to widen our view of scientific impact and to measure collaborative and engagement attitudes apart from those that occur inside formal publications. Many of these sources are open and include more information on scholarly impact. This means they can be considered as a serious alternative to traditional citation indexes as research evaluation tools, because they facilitate the identification of different types of impacts on a wider variety of outputs. This poses the question of whether we could complement or substitute traditional expensive citation indexes as research evaluation tools, now that other tools are providing similar data (free and open citation indexes) and also indicators of other types of impact.
In order to make sense of the different possibilities that now exist, the main goal of this project is to be the most complete analysis of these new web-based bibliographic tools, and to ascertain whether these different sources and metrics can reliably illustrate scientific production and impact. The analysis will be based on the comparison of these alternative sources with traditional indexes to evidence differences between both models. As a result, a prototype application will be designed as a way to propose new and alternative instruments that may be used to support research evaluation exercises.
Until not so long ago, designing and creating such an instrument would have required a significantly large investment. However, given the recent availability of a multitude of sources of scholarly data (some of them free of charge), as well as the reduction in computer storage and processing costs, the barriers to designing this kind of tool are now much lower. The reduction of storage and processing costs and the massively availability of data (Open Data) has coined the popular term Big data to allude to the extraction and manipulation of huge amount of information for complex and granulated analyses. Scientific information is not external to this transformation, and today it is possible to collect and to process huge amounts of bibliographic data from many different sources to provide a faithful representation of the state-of-art of a discipline and to design specific applications. The proliferation of different open and persistent identifiers (doi, pmid, orcid, grid, etc.) also facilitate the creation of profiles for individuals (researchers) and aggregate units (groups, institutions, countries…), and the establishment of connections between them at several levels.
LITERATURE
LITERATURE REVIEW
The applied side of bibliometrics has focused, on one hand, on developing precise instruments that inform on scientific production and impact, as well as on analysing the reliability and accuracy of the existing commercial tools. This instrumental bibliometrics acts as auxiliary technique at the service of research evaluation and scientific policy. Up to the 21st Century, few studies explored the limitations of the Science (SCI) and Social Science Citation Indexes (SSCI), the only global citation indexes available then. These studies were focused on coverage problems according to language (Luwel, 1999) and disciplines (Cole & Cole, 1971). Nevertheless, it was not until the arrival of new competitors in 2004 (Scopus, Google Scholar), when these critical analyses based on comparative approaches became more frequent. Jacsó (2005) was the first to point out the failures of the (at the time) new platform Google Scholar; Bakkalbasi et al. (2006) detected coverage differences according to disciplines and publication dates; and Meho and Yang (2007) stated that Web of Science was not enough to track all the bibliometric impact of publications. These results evidenced how the distinct source selection criteria could produce very different results in citation impact indicators. At the same time, other studies noted the power of the autonomous citation indexes. Bar-Ilan (2008) observed the significant advantages of Google Scholar collecting citations from the Web; Harzing and Van der Wal (2008) demonstrated the potential of freely available bibliographic information, developing a tool to extract citations and compute bibliometric indicators from Google Scholar (Publish or Perish); and Aguillo (2012) evidenced the advantages of Google Scholar capturing and indexing scientific literature.
The emergence of new web-based products in the style of Google Scholar (Microsoft Academic, AMiner, Scirus, etc.) opened bibliometric research to these alternative sources. Ortega (2014) was the first to compile the most important tools reviewing their functionalities from a bibliometric view. Microsoft Academic and Google Scholar were the most studied tools. As Microsoft Academic employs its own classification scheme and provides free access to its data (Academic Graph) (Hug et al., 2017; Thelwall, 2018b), and Google developed several bibliometric tools for authors (Citations) (Ortega & Aguillo, 2014) and journals (Metrics) (Delgado López-Cózar & Cabezas-Clavijo, 2012) these sources were especially suited for the intended purposes. Currently, this research interest has been extended to new bibliographic products such as Dimensions, Lens and 1findr. Preliminary studies show that many of them compare very well to traditional services (Thelwall, 2018c), while having the advantage of being freely accessible and a coverage approach that does not rely on journal selection criteria (Orduña-Malea & Delgado López-Cózar, 2018).
The creation of bibliographic services inspired by the Web 2.0 such as document sharing platforms (Academia.edu, ResearchGate) and web-based reference managers (CiteULike, Mendeley) also attracted the attention of bibliometric researchers. These online social networks give the opportunity of relating the research performance (publications, citations) with the ability of collaborating and sharing knowledge (followers/followings, posts in forums, recommendations) (Ortega, 2016). Many of these studies observed that these activities do not correlate (Ortega, 2015), as these sites are populated by different types of users (Thelwall and Kousha, 2014; Haustein and Larivière, 2014; Martin-Martin et al., 2018d) and some metrics were technically flawed (Orduña-Malea et al., 2016b). However, ResearchGate has demonstrated a great ability in capturing citations (Thelwall & Kousha, 2017) and it has become the source that offers the largest amount of freely accessible documents (Martin-Martin et al., 2018b).
A third aspect of this revolution refers to the indicators. Altmetrics’ indicators emerge as complement to traditional bibliometric ones, broadening the notion of impact activity to any event that occurred on the Web. The first studies evidenced that Mendeley readers is the only metric that correlates with citations, and therefore it has been suggested that it can be considered as an indicator of early academic impact (Maflahi & Thelwall, 2016). The remaining indicators are not strongly related to the traditional ones (Thelwall et al., 2013; Costas et al., 2015; Ortega, 2015), suggesting that they could be associated to dissemination or societal impact. These metrics are gathered by specialized data providers (PlumX, Altmetric.com, Lagotto, etc.) each with a different coverage and limitations (Meschede & Siebenlist, 2018; Ortega, 2018; Zahedi & Costas, 2018).
Other than these studies on the reliability and completeness of the new bibliographic products, applied bibliometrics has developed specific instruments that support the research evaluation. Rankings of journals (Scimago Journal Rank) and universities (CWTS Leiden ranking), and applications such as the software “Publish or Perish” support the evaluation of research units offering indicators and scores. From the commercial world, Pure from Elsevier and Symplectic Elements provide suites that allow the creation of institutional web sites that summarize and classify the bibliometric performance of organizations. In many cases, these local platforms are based on closed sources and they lack bibliometric exactitude (van Leeuwen et al., 2016). Nevertheless, there are not significant examples of national services that gather and analyse the national production at different levels and they are at disposal of research evaluation programmes. Several initiatives for implementing national CRIS ecosystems are still in its infancy. International examples are PT-CRIS in Portugal, Research Information Hub in Finland and Flanders Research Information Space in Belgium. Many of them are still in beta or they do not include metrics for assessment purposes.
In Spain, different initiatives attempted to develop different local citation indexes. The brief Citas de Autores Médicos Españoles (1991) was the first database that computed citations but it was limited to Spanish medicine journals. IN-RECS (2004-2011) was an ambitious project to compute bibliometric indicators for articles, authors, institutions and journals from the Social Sciences in Spain (Delgado-López-Cózar et al., 2005). Today, Dialnet Métricas and Portal de la Recerca de Catalunya (PRC) can be considered the most outstanding examples of similar tools. The former one is a beta local citation index based only on national publications, that analyses journals, authors and organizations. Its main limitation is that it is limited to universities and only covers some Social Science disciplines (Dialnet, 2018). The second one is a portal that gathers the research production of Catalonian organizations, which includes departments and authors. However, it does not compute impact indicators that may inform performance assessment (Parusel Turullols & Reoyo Tudó, 2018). Unfortunately, there is no initiative that intends to cover the entire national production and that includes impact indicators to inform assessment. This project attempts to fill this gap, by building a prototype platform based on open and alternative bibliographic data, and a combination of different types of impact indicators.
OBJECTIVES
OBJECTIVES
General objective
This project aims to explore the coverage of bibliographic information and metrics of the most representative scientific information sources freely accessible on the Web (academic search engines, social networks, data providers, etc.). The goal is, therefore, to identify the advantages and limitations of each service, especially as a source of data that can later be integrated in a tool that can be used by research evaluators to inform their decisions. Eventually a prototype of a national scientific information system will be designed and developed with the data collected and the indicators tested in this project. Considering this goal, two differentiated frameworks are defined:
- From a theoretical perspective, this project wants to study how these new sources and their metrics are renovating the current bibliometrics, analysing the performance of these sources and their feasibility as research evaluation tools.
- From an applied point of view, the collection of data and metrics from these new sources would enable to design and set up a portal on the Spanish science at these three levels of analysis: authors, organizations and disciplines. This product would be oriented to support research evaluation exercises.
Specific objectives
According to the theoretical perspective:
- Studying the coverage and characteristic of these new bibliographic sources, pointing their advantages and limitations with the purpose of selecting the most appropriate services, including aspects such as openness and reliability.
- Analysing the relationship among metrics with the aim to detect groups and to define different dimensions of the research impact and performance.
- Observing disciplinary differences of this impact and performance in order to distinguish different research cultures.
- Measuring the evolution over time of different metric counts and to understand in which extent these metrics are influenced between them from a time view.
- Analysing the institutional performance of selected research organizations to identify possible biases in the coverage of publications from organizations with different aims and outputs (patent applications, books, technical reports, etc.).
According to the applied framework:
- Building a website that publish the gathered data at four levels: publications, authors, organizations and disciplines.
- Designing specific indicators that capture the impact of each research unit at different levels.
METHODS
METHODS
The methodology is structured in two different components, related to the two previously defined frameworks. Therefore, each component is focused on fulfilling each specific objective. Chronologically, the results of the Component 1 will serve as a base to the Component 2. Figure 1 visually illustrates the expected workflow and the general structure of the project.
Component 1. Theoretical framework
This initial phase is going to be focused on selecting and analysing the existing web-based bibliographic services susceptible of being included in the final application. Several independent and random samples of bibliographic records will be used to compare the sources. Results of this phase could influence the development of Component 2.
1.1.Sources
Citation indexes: this group corresponds to traditional citation indexes. These sources will be only used as control group to test differences between the new and old models, but they will be excluded as candidates to feed the prototype.
- Web of Science (WoS): WoS is a platform that group different citation indexes (159M), being the Core Collection the most prestigious database (75M).
- Access: there is no endpoint to extract data, apart from the exporting functionality available in the web interface
- Scopus: created in 2006 by Elsevier, it is a multidisciplinary citation index with more than 70M of publications.
- Access: API for customers
Academic Search Engines: This group includes any bibliographic tool that extracts references and computes citations into its database, which in all cases are freely accessible on the Web.
- Google Scholar: Created in 2004, Google Scholar is an autonomous index that tracks the Web in search of scholarly documents. These documents are parsed to extract basic information and references. At the moment, it is the largest bibliographic service with an estimated size of 400M of records (Gusenbauer, 2019).
- Access: there is no endpoint to extract data, even for scholarly purposes. Using web scraping to extract data is very time-intensive, but may be useful for small to medium samples of data.
- Lens.org: it is a specialized database on patents created by Cambia in 2014. Its particularity is that it computes citations both to patents and to research papers. It includes 205M of publications from Microsoft Academic (162M), Crossref (100M) and Pubmed (29M).
- Access: open API
- Semantic Scholar: It is an initiative of the Allen Institute for Artificial Intelligence in 2015. It is also an autonomous index that crawls the academic websites extracting documents and parsing citations. It indexes almost 200M of research publications.
- Access: open API
- Microsoft Academic: This new version created in 2016 by Microsoft China contains more than 225M of publications. It is also an autonomous index (Microsoft Graph) that employs Artificial Intelligence to classify authors and publications.
- Access: open API
- Dimension.ai: This is the youngest bibliographic tool, launched in 2018. Created by Digital Science, its coverage mostly relies on Crossref and Pubmed data (Hook et al., 2018). It indexes more than 100M publications.
- Access: full access for research purposes
- 1findr: Developed by ScienceMetrix in April 2018, it is specialized in distinguishing open access publications. It includes almost 100M academic outputs.
- Access: there is no endpoint to extract data
Sharing platforms: The platforms in this group are academic social networks that support the sharing of scholarly outputs.
- ResearchGate: created in 2008, it is a social network where authors share their scientific results. It includes 130M records, of which more than the half are full-text papers.
- Access: there is no endpoint to extract data
- Academia.edu: also created in 2008, this social network is mainly populated by humanists and social scientists. It gathers close to 100M documents.
- Access: there is no endpoint to extract data
Altmetric Data providers: This category comprises services that aggregate counts from different web sources relating to the societal impact of scholarly publications.
- Altmetric.com: created in 2012, it is part of Digital Science. It is the service with better coverage of events from social networks (Twitter, Weibo, Google+) and blogs and news. It includes more than 12M documents.
- Access: public API
- PlumX: also created in 2012, PlumX was acquired by Elsevier in 2017. It is the service with the largest coverage, 53M documents.
- Access: API for customers
- Crossref Event Data: it is a beta service provided by Crossref in 2017. It is not exactly an aggregator because it just records the events about documents with DOI. It size is small in comparison with Altmetric.com and PlumX (Ortega, 2018b).
- Access: open API
1.2. Data extraction and processing
Initially, we intend to analyse three different samples in this phase:
Random sample: A representative sample of random DOIs (Document Object Identifier) from Crossref, the agency that gives that identifier to any publication, will be gathered. This identifier is selected because it is by far the most widely-used article-level persistent identifier, supported by most bibliographic databases in their retrieval systems.
Google Scholar sample: this sample was extracted from Google Scholar Citations and it comprises all public Google Scholar profiles of researchers working in Spain at the time of data collection (2017). This sample is used because Google Scholar is the largest scholarly bibliographic search engine (Gusenbauer, 2019) and their data would provide a wider view on publication types that commonly lack a DOI (books, reports, etc.) (Martín-Martín et al., 2018a).
Institutional sample: This is a specific sample for the Institutional Analysis (1.3. Analysis) and it will contain the most complete research production of several selected academic organizations. Local services like the public CRIS (Current Research Information System) and the IR (Institutional Repository) systems will be used to obtain the bibliographic metadata of the full set of publications (recent papers, books and book chapters) and personal information of the authors. Each item will be identified in all of the external sources. Indicators will also be collected and classified for comparative purposes both at the level of disciplines and authors/groups. Additionally, this sample will be used to test the completeness of different sources, paying special attention to differences between the scholarly organizations intentionally chosen by their diverse typology.
The documents of the three initial samples will be searched in each platform to test if they are indexed. In that case, bibliographic information and metrics will be extracted from each DOI (when available). Because each tool provides different access forms, we will use different strategies to obtain the required information:
- Public APIs: an application will be written.
- Access for research purposes: formal permission will be requested to access the data (dump files).
- No endpoint to extract the data: web scraping techniques will be employed.
To automatically extract this information several scripts (Python, R, SQL., etc.) will be written. Next, several instruments will be used to clean and process the data (e.g. OpenRefine), removing duplicated, restoring incomplete information, etc. Finally, this information will be stored in a relational database (MySQL or similar) in which data from each platform are linked between them by DOIs.
1.3. Analysis
Several analyses will be carried out from this data set to answer the specific objectives of the Component 1:
Comparison among platforms: This exploratory analysis will compare the number of publications and metrics counts. This information will allow us to identify the size of each database and the significance of their indicators. In addition, the availability of additional metadata that is useful for bibliometric analyses (author affiliations, type of document, language, sources, funding acknowledgments, etc.) and the quality and management of the grouping and classifying systems (Subject matter schemes, normalized list of organizations, Authors disambiguation, etc.) will be analysed.
Meanings of the metrics: a key aspect of this project is to understand the meaning and scope of the metrics provided by each service. These metrics will be compared to detect what service supplies more consistent and reliable indicators. In the case of non-comparable metrics, several statistical techniques (Clustering, Principal Component Analysis) will be employed to set groups of metrics and to define different components or dimensions of impact.
Differences between the disciplines: Another relevant issue is to observe significant differences between research areas. Documents of the sample will be thematically classified according to a subject category classification. This will allow us to observe differences in the coverage of publications by each platform, observe different types of impacts and select suitable indicators for each discipline.
Longitudinal study: using a synchronous approach, this analysis will study the counts of each metric over time to identify when each type of impact typically occurs. This information will be compared across different sources and between disciplines.
Institutional analysis: a key element is to know how the total production of an organization can be gathered by different scientific databases. This section will select some representative organizations to observe how their production and impact is reflected in these new services, emphasising on differences between document types, time frames and thematic distributions.
Automatic classification of publications: one of the most relevant criticisms to the traditional model is that their pre-defined subject matter classification systems for journals are used to classify authors and publications. This approach has many limitations. Our approach will attempt to develop an article-level classification system using state-of-the-art document clustering algorithms. The system will ideally have various levels of aggregation, in order to facilitate analyses both at the level of large scientific areas, and at the level of particular scientific specialties.
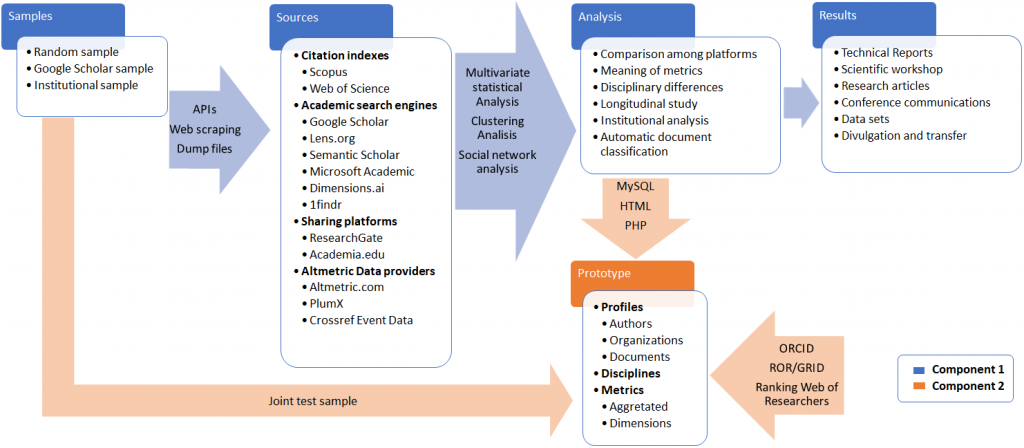
Figure 1. General structure of the project
Component 2. Applied framework
The next phase is the building and designing of a prototype of web portal that gathers the research production and impact of Spanish science. This component will be developed according to the results of the Component 1.
2.1. Sources and metrics
Results obtained in the Analysis section (1.3.) will determine the selection of sources and metrics. The selection of sources will be defined according to completeness and openness criteria. The selection of metrics will be established according to meaning and frequency. The prototype will be implemented with the data collected in the Component 1 (1.2. Data extraction and processing). A list of authors and organizations from external sources will be selected to aggregate the bibliographic records.
2.2. Architecture
A relational database (MySQL or similar) will be designed to manage the publication metadata and the metrics. This database will feed the information system of the web portal. Although the specific implementation will very much depend on the results of Component 1, we expect that this information system will be structured in four axes, which will be interrelated and established according to four main entities:
Publications: each record will display its bibliographic information (metadata like the title, authors, abstract, keywords, etc.), as well as the evidences of impact that we are able to collect, and the indicators calculated using these evidences. This is the basic unit of information in the system.
Authors: The web site will incorporate a personal profile that will show the list of publications assigned to each author, including the absolute and relative values of the selected metrics. In addition, the application will allow to authors, after registration, to edit, correct or filter their own items. Each profile will be connected with other profiles (co-authors), organizations and disciplines (keywords).
Organizations: each organization will have a profile that groups publications. This part will show aggregated information of their authors and publications, including total and relative indicators.
Disciplines: each publication will be automatically classified according to the Automatic classification of publications (1.3. Analysis). This result will allow to group authors and organizations according to the thematic classification of their publications. A general ad-hoc scheme will be designed to establish main categories. The design of the scheme will be established according to depth, broadening and adaptation to the system.
2.3. Indicators
The development of the application will be useful to investigate the design of specific indicators that score the aggregated and multifaceted impact of authors and organizations. These indicators will take into account:
Computing several metrics: these indicators will be composite measures that aggregate the impact of different metrics belonging to a similar type of impact or dimension (for example, mentions on Twitter and Facebook be aggregated as social network impact).
Incidence: These indicators will be sensitive to the incidence (frequency of appearance) of a metric in a specific set of documents, giving more relevance to infrequent and hard events than to easy and very common actions.
TEAM
TEAM
Research team
José Luis Ortega (IESA- CSIC) (Principal researcher)
Emilio Delgado López-Cozar (University of Granada)
Isidro Aguillo (IPP-CSIC)
Alberto Martín-Martín (University of Granada)
Enrique Orduña (Polytechnic University of Valencia)